Visualize UK Census Data with AreaInsights
Explore and understand demographic trends across the United Kingdom with our intuitive data visualization tools.
Get Started
Enter your area name or postcode to discover detailed insights about your neighborhood
Try searching for "London", "Manchester", or your local area
Explore Comprehensive Insights
Area Comparision and Diversity through Census Data using advanced demographic analysis tools and geographic visualization.

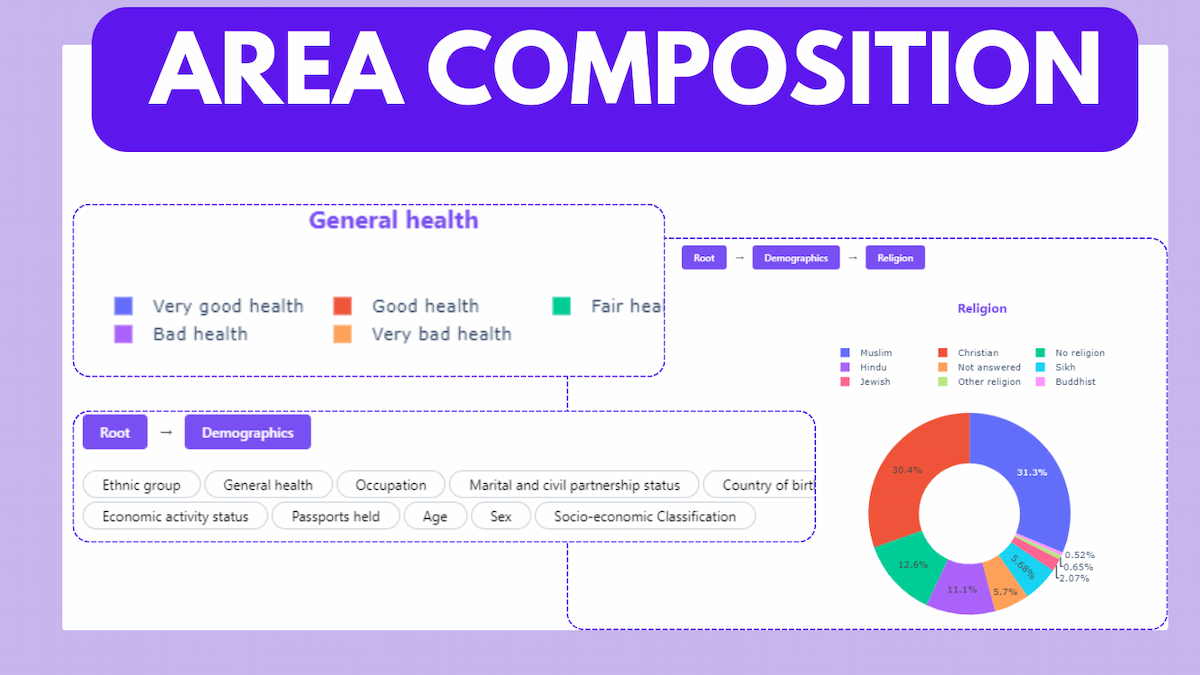
Area Composition Breakdown
Explore a detailed breakdown of diverse census categories. The composition of each category is meticulously detailed, expressed both in terms of percentages and absolute numbers, offering a nuanced understanding of the community's demographic makeup.

Geographic Visualization
Immerse yourself in our interactive maps, accessible at both borough and ward levels, elegantly illustrating diverse geographies through a dynamic color scale. With advanced zoom functionality, delve into the details that matter.

Innovative Approaches to Census Data Comparison
Discover a seamless way to compare an extensive array of census metrics across different areas. Our website features an interactive visualization tool that enhances your data exploration experience.
Area facts
Area overview
• Population and its average age
• Number of households, average household size
• Land area, Population density
• Crime Rates and crime types
Personal Identity
Identity of the individuals, ethnic and religious diversity
• Religions
• Ethnicity
• Age and Sex
• Birth country, passports held
Families and Relationships
Explore the household composition of an area
• Single family households
• Married or civil partnership
• Households with children
Housing Characteristics
Housing arrangements, stability and people's relationship with their home
• Accommodation Type, Size and composition
• House ownership
Economic Activity
Individual's role in the economy, their position and professional categorizations
• Economic Activity
• Socioeconomic classification and occupation
General Well-being
Personal health and community well-being
• General health of the population
• Household deprivation